
Using Data Analytics to Improve Learner Performance in Ghanaian Basic Schools
Schools already collect attendance registers, test scores and end-of-term results. Used well, those records can show which learners need help, and early. A practical guide to attendance patterns, assessment trends, early warning indicators, dashboards, data quality and handling learners' information ethically.


In this article
Every Ghanaian basic school collects data, whether or not anyone calls it that. Registers are marked every morning. Class exercises, tests and end-of-term examinations are scored and recorded. Most of this information ends up in a register, on a report card or in a filing cabinet, and is looked at once. Data analytics, in a school, simply means turning those records into timely answers to practical questions. Which learners are missing school most often? Which topic did most of the class get wrong? Whose results are slipping, and since when? This article explains how schools can ask and answer those questions, and where the limits of the evidence lie.
Why it matters
National assessment data shows the scale of the challenge. In December 2021, the first census-based National Standardised Test assessed 431,206 Primary 4 learners in 14,886 schools across all 16 regions. It found that 62% of learners performed below the basic level in Mathematics and 50% in English Language. The report recommended that poorly performing regions and districts receive targeted interventions (NaCCA, 2021).
National tests describe the system. They cannot tell a class teacher which three learners in their class are falling behind this month, or why. That is the job of the data the school already holds.
What data a school already has
Attendance: daily registers for every learner.
Continuous assessment: class exercises, homework, class tests and projects.
Examinations: mid-term and end-of-term scores by subject.
Background information: age, class history and contact details. This is the most sensitive category and needs the most care.
Four kinds of analysis worth doing
1. Attendance patterns
Start with each learner's attendance rate: days present divided by days the school was open. Then look for patterns across the class. Are absences higher on market days, on Fridays, or in particular weeks of the term? A pattern points to a cause that the school may be able to address with families or the community.
A common definition of chronic absence is missing 10% or more of school time. It is used, for example, in the early warning study described below (Faria et al., 2017). As an illustration, in a term of 60 school days, a learner who misses 6 or more days would meet that threshold. Ghanaian schools are free to choose their own threshold, but it helps to have one, so that concern is triggered by evidence rather than by impression.
2. Assessment trends for each learner
One poor test result can mean anything: illness, a bad day, a confusing question. A steady decline across several assessments is different and deserves attention. Plotting each learner's scores across the term, even on paper, separates the two.
To compare results fairly, convert scores to percentages first. A learner who scores 12 out of 20 and then 25 out of 50 has gone from 60% to 50%; the raw numbers alone would suggest an improvement.
3. Subject and topic trends for the class
Sometimes the pattern is not in a learner but in a topic. If most of the class got the same question wrong, the likeliest explanation is that the topic needs re-teaching or the question was unclear, not that most of the class is weak. Looking at results question by question, an approach often called item analysis, is one of the most useful habits a teacher can build.
Be careful comparing classes with each other. Different teachers, different tests and different groups of learners mean that a gap between two classes may not reflect the quality of teaching at all.
4. Early warning indicators
An early warning indicator combines a few simple signals to identify learners who may need support before they fall far behind.
The best-known research comes from the United States. A study that followed almost 13,000 students in Philadelphia found that four simple indicators in the sixth grade identified 60% of the students who would later fail to graduate. The indicators were attending school 80% of the time or less, failing mathematics, failing English, and receiving a poor final behaviour mark (Balfanz, Herzog and Mac Iver, 2007).
That finding is important, but it comes from urban middle schools in another country, and it predicts graduation, not learning. Whether the same indicators work in Ghanaian basic schools is discussed below.
From data to action
Data helps learners only if someone acts on it. When a learner is flagged, the first step is to find out why:
For attendance: speak with the learner and contact the family. Absence may be caused by illness, work at home or in the market, distance, fees or problems at school. Each needs a different response.
For learning: re-teach the topic, work with a small group, pair the learner with a supportive classmate, or provide extra practice.
For the school: hold a short monthly meeting in which teachers review the flagged learners in their classes and agree on one action for each.
Research from elsewhere shows both what this can achieve and its limits. In a randomised trial in 73 high schools in the United States, schools that used an early warning and intervention system had lower rates of chronic absence (10% of students, against 14%) and course failure (21%, against 26%) after one year than schools that continued as before. The same study found no detectable effect on the share of students with low grades, on suspensions, or on progress in earning credits. In the schools' own records, fewer than 30% of flagged students had been assigned to any intervention, and the researchers could not say which staff actions caused the improvements (Faria et al., 2017). Note what that system was: simple flags based on attendance and grades, followed by staff action. It was not a predictive model, and the study did not measure learning. The lesson for any school is clear: a flag on a screen is only the beginning.
Dashboards: useful when simple
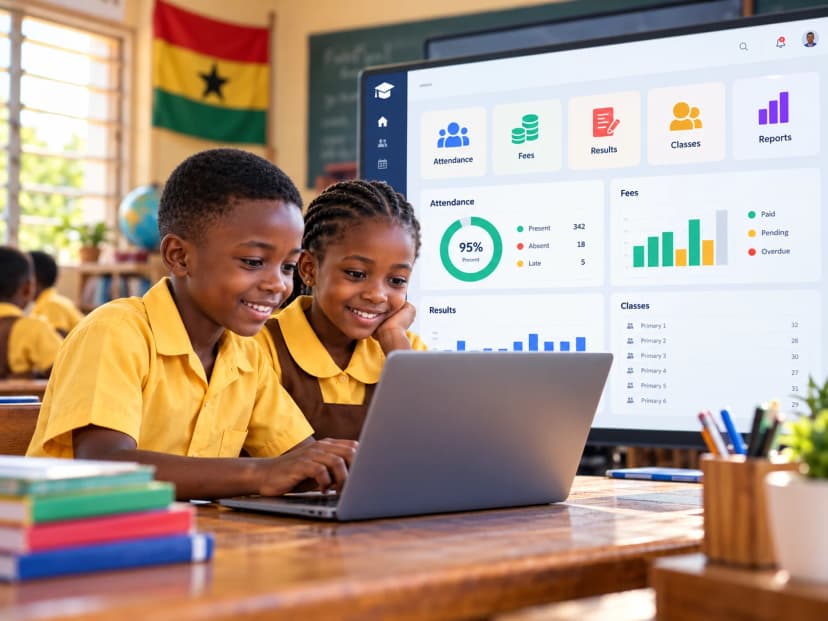
A dashboard is a screen or page that summarises data at a glance. A good school dashboard answers a few questions well:
Who has been absent most this month?
Whose scores have dropped since the last assessment?
Which topics did each class find hardest?
A list of names with a reason next to each is often more useful than an attractive chart, because it tells the teacher whom to talk to. A dashboard does not need special software either. A well-organised spreadsheet, or even a tally chart on paper, can answer all three questions.
Avoid displaying individual learners' scores or rankings publicly. A league table of learners or teachers can do more harm than good.
Data quality: wrong data leads to wrong decisions
Analysis is only as reliable as the records behind it. Common problems include:
registers that were not marked, or were filled in later from memory;
the same learner recorded under different spellings of their name;
scores out of different totals added together without conversion;
missing marks recorded as zero, which turns "absent for the test" into "scored nothing";
comparing tests of very different difficulty as if they were the same.
A few simple rules help a great deal: mark the register at the same time every day, use one agreed spelling of each learner's name, record every score with its total, and leave missing marks blank rather than entering zero.
Three kinds of evidence, kept apart
It is worth being precise about what data analytics can and cannot claim. The evidence falls into three groups, and they should not be mixed.
Established research findings, from other countries
In the settings studied, mostly urban schools in the United States, low attendance and course failure are associated with later dropping out. In one well-designed trial, an early warning system lowered rates of chronic absence and course failure in its first year, without detectable effects on several other measures. These are real findings, but they come from different school systems and measure attendance, course results and graduation, not learning itself.
Ghanaian educational evidence
Ghana's national assessments, such as the National Standardised Test, show how learners are performing across the country and where the gaps are largest. I have not found published research testing which early warning indicators or thresholds work in Ghanaian basic schools, or whether early warning systems improve learner outcomes here. Until such evidence exists, schools should treat indicators as sensible starting points, not proven tools.
Proposed predictive applications
Some software promises to predict which learners are "at risk" using statistical or AI models. There is no evidence that such systems improve learner outcomes in Ghana. Predictions can be wrong, and they can reflect poverty, disability or distance from school rather than a learner's ability. No prediction should be used to label a child or limit their opportunities. A flag is a prompt for a teacher to look more closely, never a verdict.
Handling learners' information ethically
Learner records are information about children, and they deserve careful handling.
Collect only what you need, for a clear purpose such as supporting learning or contacting families.
Limit access. A class teacher needs their own class's records. The head teacher needs the whole school's. Nobody else needs either by default.
Never post individual results publicly, and avoid labels such as "weak learners" on lists that others can see.
Store records securely, whether on paper or on a computer, and keep backups.
Be open with parents about what the school records and why.
Make support, not punishment, the purpose. A learner flagged for absence needs help, not humiliation.
In Ghana, the Data Protection Act, 2012 (Act 843) governs the processing of personal data, and the Data Protection Commission is the regulator established under it. Schools should seek proper advice on how the law applies to them. A later article in this series looks at protecting school data in more detail.
Conclusion
Data analytics in a basic school does not start with software. It starts with accurate registers, carefully recorded scores, and the habit of asking regular questions of them. Used that way, the records schools already keep can help teachers notice struggling learners earlier and respond more precisely. Used carelessly, they can mislead or label children unfairly. The difference lies in data quality, honest interpretation and a commitment to act on what the data shows.
Try this at the end of the month: Count the days each learner in your class was absent. List every learner who missed 10% or more of the school days. Beside each name, write one possible reason and one action you will take. Repeat next month and compare the two lists.
Disclosure: MosTek Solutions develops school management software, which includes attendance and assessment reporting. This article does not recommend any particular product.
References
Balfanz, R., Herzog, L. and Mac Iver, D. J. (2007). Preventing student disengagement and keeping students on the graduation path in urban middle-grades schools: Early identification and effective interventions. Educational Psychologist, 42(4), 223–235. PDF
Data Protection Act, 2012 (Act 843). Republic of Ghana. Official PDF via the Data Protection Commission
Data Protection Commission, Ghana. dpc.gov.gh
Faria, A.-M., Sorensen, N., Heppen, J., Bowdon, J., Taylor, S., Eisner, R. and Foster, S. (2017). Getting students on track for graduation: Impacts of the Early Warning Intervention and Monitoring System after one year (REL 2017–272). U.S. Department of Education, Institute of Education Sciences. PDF
National Council for Curriculum and Assessment (2021). Ghana 2021 National Standardised Test: Report Findings. Ministry of Education, Ghana. PDF
About the author
Moses Bentum
Moses Bentum is a Ghanaian educator, software developer, and founder of MosTek Solutions. With a background in Science Education and Information Technology, he develops innovative software solutions for schools and businesses. His interests include artificial intelligence, educational technology, data analytics, and digital transformation. Through MosTek Insights, he shares practical knowledge, research perspectives, and technology-driven solutions.
More from Moses Bentum